Lamont
Associate Research Professor Heather Savage explains how scientists are
using biomarkers and temperature to locate past earthquake activity.
When you rub your hands together to warm them, the friction creates
heat. The same thing happens during earthquakes, only on a much larger
scale: When a fault slips, the temperature can spike by hundreds of
degrees, high enough to alter organic compounds in the rocks and leave a
signature. A team of scientists at Columbia University’s Lamont-Doherty
Earth Observatory has been developing methods to use those organic
signatures to reconstruct past earthquakes and explore where those
earthquakes started and stopped and how they moved through the fault
zone. The information could eventually help scientists better understand
what controls earthquakes.Lamont geophysicist Heather Savage and geochemist Pratigya Polissar began developing the methods about eight years ago, building on techniques used by the oil industry. Their unique pairing of two fields – rock mechanics and organic geochemistry – made possible innovations that are changing how we look at earthquakes.
The process starts in the field, along a fault where scientists either chip off or drill samples from inside the fault zone. When sediments in a fault zone are heated by the friction of an earthquake, that short but powerful burst of heat alters the chemical composition of organic material inside the rock. (The same process over long periods of time creates oil and gas.) Scientists can examine the organic compounds in those samples and compare the ratio of stable molecules to unstable molecules to measure their thermal maturity and determine how hot each sample became.
“If even a tiny structure within a fault has had an earthquake, we can actually see the difference between how hot that piece of the fault got versus everything outside of it,” Savage said. “What we want to figure out is where the earthquakes in this big fault zone were actually happening. Do they all happen to one side? Are the distributed throughout? Are they all clustered on the weakest material within the fault zone?”
“What this does is give us a picture, almost like a heat map, of the fault itself, and the hottest places are where the earthquakes happened,” Savage said.

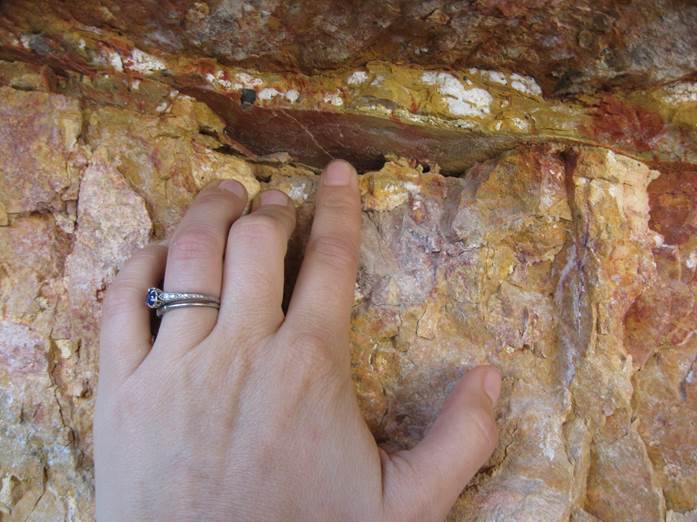
Heather
Savage's team sampled all along the Muddy Mountain thrust in Nevada and
made some surprising discoveries. Photo: Heather Savage
When temperatures are high enough, rock can melt, creating glass-like
pseudotachylytes. Geologists have used these melted rock remnants for
several years, but finding them is rare.Savage, Polissar, and their team are looking closer, to the molecular level, where they can measure the thermal maturity of common organic compounds to determine how hot the sample became. They often test for methylphenanthrenes, organic molecules that are fairly common in faults within sedimentary rocks between 1 and 5 kilometers below ground. In deeper faults, some 10-14 kilometers down, the scientists can look for diamondoids, which are among the most thermally stable organic compounds.
To put their molecular data into context, the scientists also need to understand how rocks in the fault react to heat and pressure. In Lamont's Rock and Ice Mechanics Lab, Savage’s team can test rock samples under a wide range of high pressures and temperatures. From their experiments, they can develop models that show how much shear stress and displacement are required to generate specific levels of heat in specific types of rock, and then how that heat will decay through diffusion.
Using these models, the scientists can then look at the geochemical analysis of their samples, determine the temperatures the compounds were exposed to in the past, and estimate the friction from the earthquake and how far the fault slipped.
For example, when the team tested samples from the Pasagshak Point megathrust on Alaska’s Kodiak Island, they measured the ratio of thermally stable diamondoids to thermally unstable alkanes and determined that the temperature during a past earthquake would have risen between 840°C and 1170°C above the normal temperature of the surrounding rock. From that temperature rise, they were able to estimate that the earthquake’s frictional energy would have been 105-227 megajoules per square meter, likely a magnitude 7 or 8 earthquake. Using their experimental friction measurements, they could then estimate that the fault must have slipped 1-8 meters.
At the American Geophysical Union Fall Meeting today in San Francisco, Genevieve Coffey, a graduate student in Savage's team at Lamont, presented early results from their highest-density testing yet, involving samples taken in transects along the Muddy Mountain thrust in Nevada. One surprise was that the places where one might expect to see high temperatures because of the local structures in the rock were not necessarily the locations where they found it, Coffey said. "Structural variability along a fault does not necessary indicate that slip has occurred along that section," she said.
Savage’s team is working on similar experiments at the San Andreas fault, and the Japan trench where the Tōhoku earthquake began, and they are working with colleagues on techniques to date the earthquakes.
“The important step for us is to determine how each of those compounds reacts to time and temperature,” said Savage, who received the 2016 Mineral and Rock Physics Earth Career Award at AGU this week. “That’s going to tell us about the physics of the earthquakes in that fault, which in the long run could lead to a better understanding of earthquake hazards.”

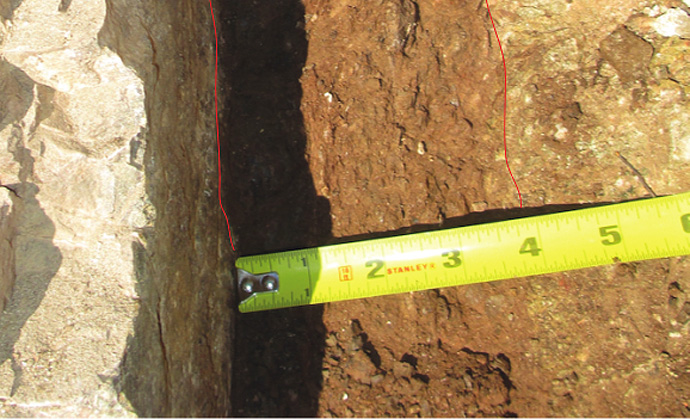
Faults
can be thin cracks or wider zones with crushed rock inside. It’s
difficult to tell from looking at them where in the zone earthquakes
might have happened in the past. This is part of Punchbowl Fault, along
the San Andreas system. Photo: Heather Savage
http://www.ldeo.columbia.edu/news-events/creating-earthquake-heat-maps-temperature-spikes-leave-clues-rock?platform=hootsuite
No comments :
Post a Comment