Ionospheric Data.
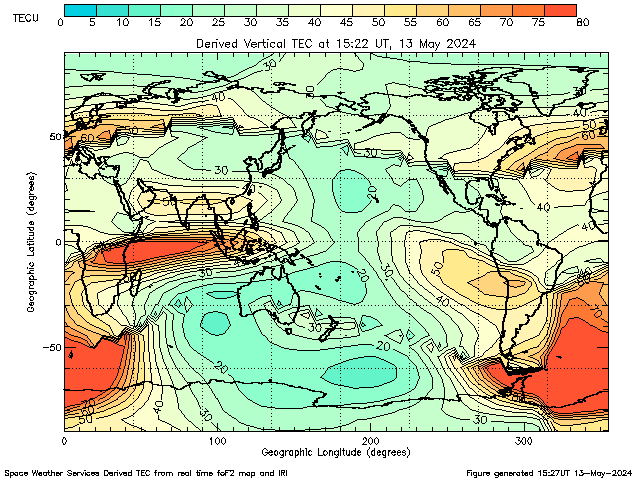
TEC of the Day
TEC of the Day from NASA
GOES Magnetometer
The GOES magnetometer products are an integral part of the National Oceanic and Atmospheric Administration (NOAA) space weather operations, providing information on the general level of geomagnetic activity and permitting detection of magnetic storms and substorms. In addition, these measurements will be used to validate large-scale space environment models that will be added to SWPC operations in the future.
Historically, the data have been presented in the E (earthward), P (parallel) and N (normal) coordinate system where:
Hp: magnetic field vector component, points northward, perpendicular to the orbit plane which for a zero degree inclination orbit is parallel to Earth's spin axis.
He: magnetic field vector component, perpendicular to Hp and Hn and points earthward.
Hn: magnetic field vector component, perpendicular to Hp and He and points eastward.
Ht: the total field.
The GOES 3-day Hp plot shows the 1-minute averaged parallel component of the magnetic field in nanoTeslas (nT), currently measured at GOES-13 (~75 degrees west geographic longitude) and GOES-15 (~135 degrees west geographic longitude). The longitudes can vary, so for any particular case it is important to check the satellite location. A diurnal variation is observed in these data as a result of magnetospheric currents systems that, at geosynchronous orbit, produce a stronger magnetic field on the dayside of Earth and weaker magnetic fields on the nightside. If these data drop to near zero, or less, when the satellite is on the dayside, it may be due to a compression of the Earth's magnetopause into the geosynchronous orbit boundaries, exposing satellites to negative and/or highly variable magnetic fields. On the nightside, the smaller field values indicate strong currents in the magnetotail that are often associated with the stretching and subsequent release of energy in Earths tail. This is one signature of a “substorm” that results in aurora at Earth’s high latitudes and energetic particle injections in the vicinity of geosynchronous orbit.
Noon and midnight local time at the satellite are plotted as N and M. Default scaling is 0 to 200 nanoTesla. Non-default scaling to include infrequent extreme values is labeled in red to emphasize the change in scale.


No comments :
Post a Comment