California window of vulnerability has opened today, and as we have published here from beginning of June the peak seems to be tomorrow 26th, as can be seen by the CA earthquake calendar.
Let us look again today the sensory data in this region....The map below is Carbon Monoxide emitted by the stressed area. We can see the black spot is high concentration!
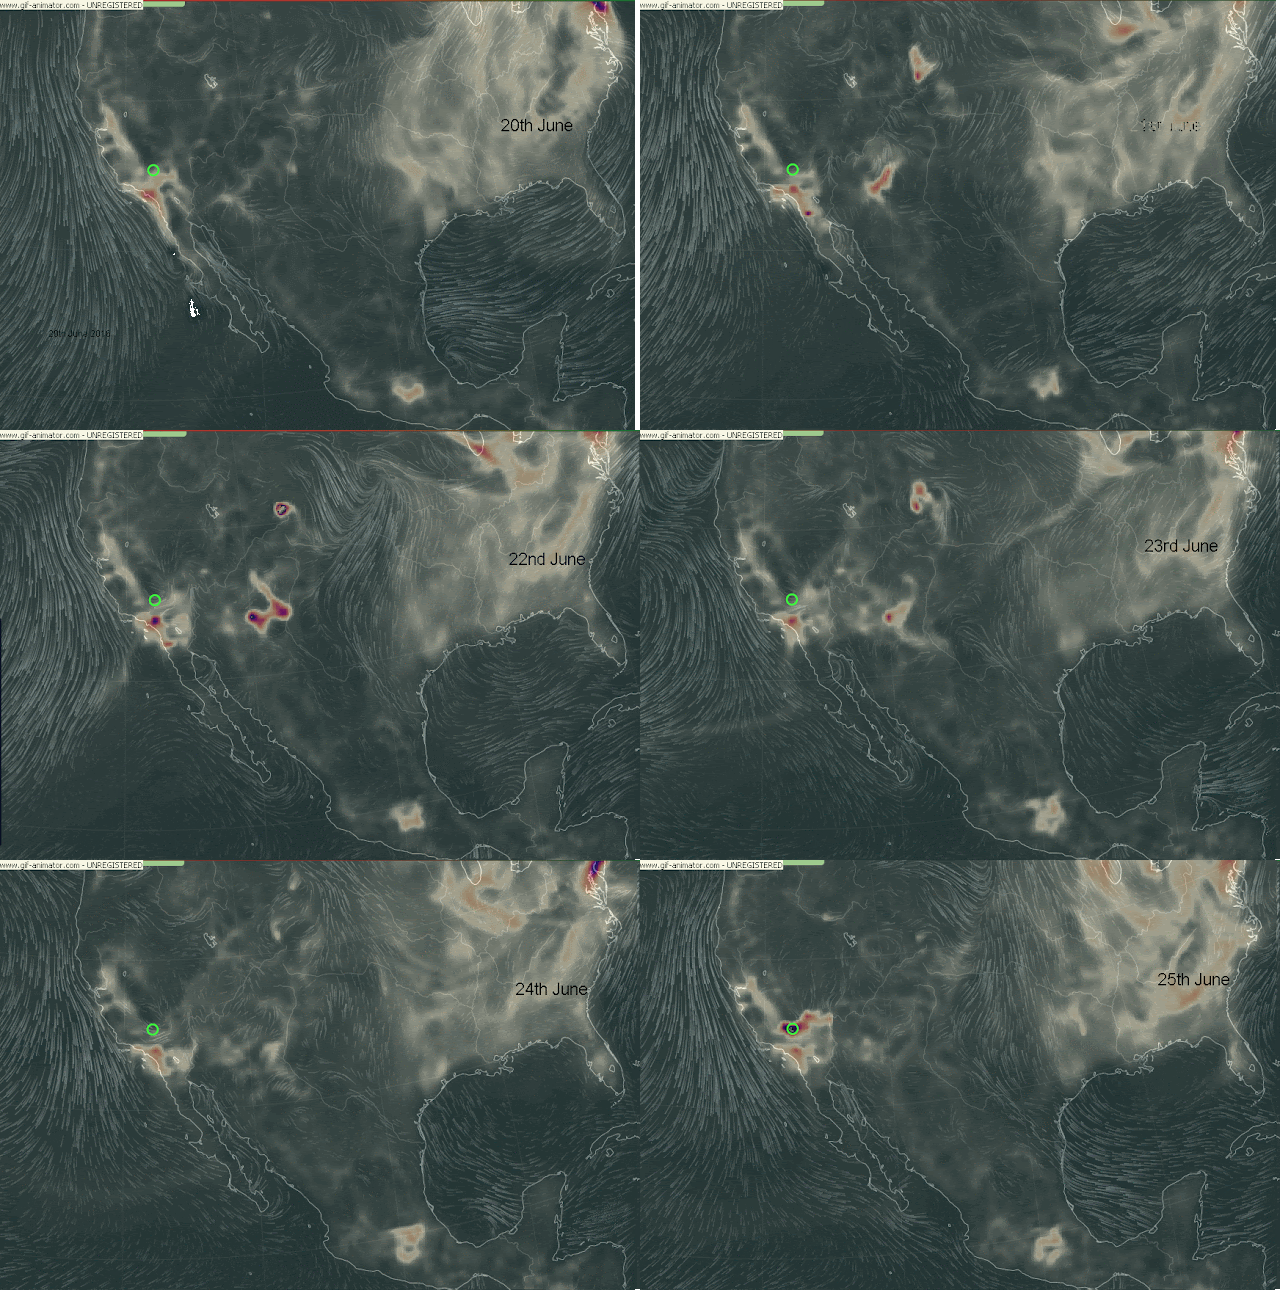
Here is an animation of the CO emissions over the last few days, showing today's strong emissions
Stressy times in North America, a post back in May, was the first time we pointed out at this spot focusing from our software runs.
Today the map above shows the significant increase of CO emission from this region! Is it a precursor to an event in this region?
The map below is the SO2 (sulphur dioxide gas) emission over the same region. Again there is strong emissions in the area.
At the same time we can look at CO2 (carbon Dioxide). The map below shows the same increase as with the other gas emissions in the same spot.
Be Safe be Good!


No comments :
Post a Comment